Grace Murray Hopper said that one accurate measurement is worth a thousand expert opinions. However, it’s hard to measure phenomenons, without strictly defining them. This article is a gentle introduction to web application performance measurements.
Difference between latency and response time
Response time and latency are distinct concepts that play crucial roles in describing performance of the web applications.
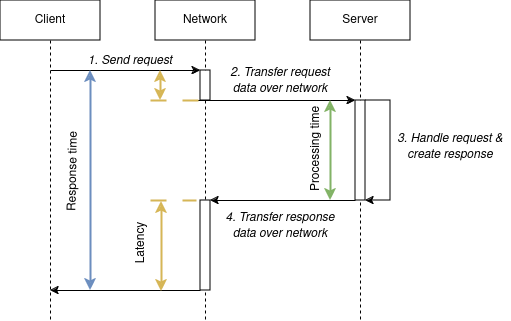
Latency is how much time data transfer from client to server takes, while response time is a whole data processing time measured on the client side.
Response time includes the network round trip time. In other words, response time measurement includes network latency.
 Simple in theory, but in practice the actual definition of the measure comes from the tool you use.
Gatling defines response time as a time from the moment it tries to resolve DNS and establish connection to a target host till the last byte of the response is received or any error happens.
JMeter’s definition introduces ambiguity:
JMeter measures the latency from just before sending the request to just after the first response has been received. Thus the time includes all the processing needed to assemble the request as well as assembling the first part of the response, which in general will be longer than one byte.
Which one is right? Well, the Gatling’s definition, as well as the definition from the beginning of the article, corresponds the Cambridge Dictionary definitions for latency and response time:
Latency is the delay between an instruction to transfer computer information and the information being transferred, for example over the internet.
Response time is a measure of the time it takes a computer to react to a request to do something.
What is request processing time or duration
Response time is a good measure to evaluate how the software is seen by the end user, but this measure heavily depends on the back-end infrastructure and the network distance between client and server.
The more proxy components are located between client and server, the more is the latency’s part in the response time. In the edge case, when the software is relatively simple web service while an infrastructure contains WAF and API Gateway deployed in front of the AWS Lambda Functions running across multiple AZ, the response time may characterize more infra rather than software. There’s an article in this blog about relation between number of components in a distributed system and heavy tails of the response time distribution. A better way to describe software performance is to measure time between the start and the end of the request processing at the back-end side.
Nginx has a concept of request processing time - time elapsed since the first bytes were read from the client.
Envoy proxy introduces duration concept - a total duration in milliseconds of the request from the start time to the last byte out. Jetty defines duration simply as time taken to serve the request (%D in access log format definition). Tomcat measures time from the first byte received till the first byte sent (%D) and time from the first byte received till the last byte sent (%F).
Difference between wall-clock time and CPU time
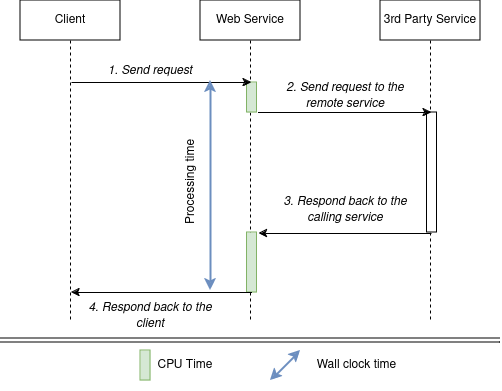
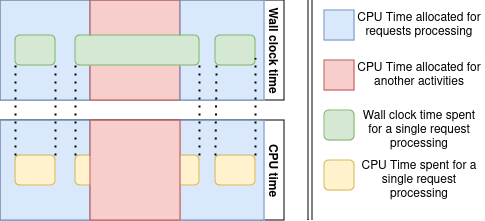
Request processing time is a wall-clock time that differs from the amount of time the CPU is actually busy with processing of a particular request. Consider the following scenarios:
-
Request has arrived, the start time has been stored, but there’s no free CPUs to process it, so the request waits in the queue. There’s an article in this blog about the exponential relation between incoming requests rate and the processing time.
-
The request processing requires additional calls to other microservices. If the asynchronous processing is employed, the CPU is used by other tasks while the server waits for responses. In this case the CPU time is also less than the wall clock time.

-
The request is being processed by the server, but the operating system decides to allocate CPU time slots to other web-application threads. For example, garbage collection starts. Once again, wall clock time is greater than CPU time.
 Hence, processing time highly depends on the infrastructure and the response time of the connected services.
 -
Parallel data handling is an opposite example. In this case wall clock time of the request processing can be significantly less than corresponding CPU time.
There are multiple strategies to measure CPU time: you may use special tools called profilers to employ CPU sampling or develop a microbenchmark to test the suspicious piece of the code.
The idea of CPU sampling is straightforward. A tool like VisualVM or YourKit connects directly to the Java Virtual Machine and takes a series of snapshots of what methods are actually run by the CPU at specific point of time and then calculates the stats. The main advantage of this method is that you shouldn’t change anything inside the application to profile it. However, the accuracy of measurement is affected by sampling error. Sampling error increases when the sampling rate decreases and vice versa. Profilers are great to detect slow pieces of code, good to confirm major performance improvements, but usually you have ro run a load test to get enough samples.
In case of microbenchmark a separate program is developed to test performance of a small piece of the code. Isolation is the key concept of microbenchmark. The aim is to create a program where nothing else happens, except the execution of a small piece of the code thousands of times in a loop, so the wall clock time can be considered equal to the cpu time. Special frameworks like JMH (in the Java world) and explicit configuration of the CPU affinity helps to reduce microbenchmark measurement error.
In practice, both strategies complement each other. First, the profilers are used to locate major bottlenecks of the application, and then microbenchmark is developed for small specific parts of the code to iterate fast over the performance improvements and prove the positive effect of the change.